Dogs vs Cats Classification - Transfer Learning using Tensor Fl


This project is to detect a picture is whether for Dog or Cat. Write an algorithm to classify whether images contain either a dog or a cat
Problem: To detect the where the given picture is for Dog or Cat
Data Data is coming from the Kaggle
Note:- I using google colab for this model. So you have to save data in your google drive and connect your google drive to google colab.
Evaluation: For each image in the test set, predict a label for its id (1 = dog, 0 = cat):
Features:- There is train data with 25k images with label 1 = dog and 0 = cat There is test data with 12.5k images with no labels
Code:-
First, we have import some module which will be needed in future
# import EDA(Exploratory data analysis)
import pandas as pd
import numpy as np
%matplotlib inline
import matplotlib.pyplot as plt
from IPython.display import Image

# import evaluation data
import tensorflow as tf
import tensorflow_hub as hub
Getting data from the file
- Set the label according to pic name provided, if in pic name 'cat' present then set the label as 0 and if in pic name 'dog' present set the label name like '1'
- Some visualization of the picture
# Get the all picture name list
import os
pic_name_list = os.listdir('/content/drive/My Drive/Dog vs Cat/train')
len(pic_name_list)
Result -
25000
Check the list of name
pic_name_list[:5]
result -
['cat.9552.jpg',
 'cat.9562.jpg',
 'cat.9545.jpg',
 'cat.9542.jpg',
 'cat.9590.jpg']
- Now in a given training data label is not found so you have to set your own labels using picture name.
picture_label = []
for i in range(len(pic_name_list)):
  picture_label.append(pic_name_list[i].split('.')[0])

len(picture_label), picture_label[-5:]
Result
25000
['dog', 'dog', 'dog', 'dog', 'dog']
- Now will get file pathname of all the picture which will use as a feature.
## Get the filenames for the picture
file_name = ['/content/drive/My Drive/Dog vs Cat/train/' + obj_name for obj_name in os.listdir('/content/drive/My Drive/Dog vs Cat/train')]
file_name[:5]
Result
['/content/drive/My Drive/Dog vs Cat/train/cat.9552.jpg',
 '/content/drive/My Drive/Dog vs Cat/train/cat.9562.jpg',
 '/content/drive/My Drive/Dog vs Cat/train/cat.9545.jpg',
 '/content/drive/My Drive/Dog vs Cat/train/cat.9542.jpg',
 '/content/drive/My Drive/Dog vs Cat/train/cat.9590.jpg']
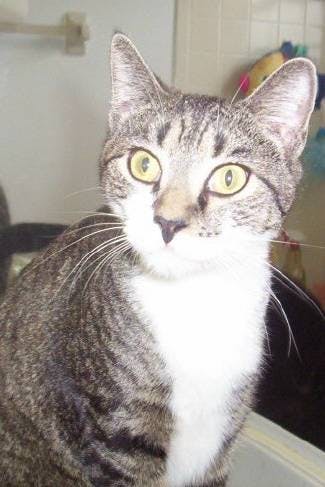
Now check the path name is correct of not
## Display some picture
Image(file_name[1])
Result
Another example
Image(file_name[-1])
Result

- Creating a data frame for our data
# Creating the data fram
df_catvsdog = pd.DataFrame({'file_name':file_name,
                            'picture_label':picture_label},)
df_catvsdog.head()
Result
    file_name    picture_label
0    /content/drive/My Drive/Dog vs Cat/train/cat.9...    cat
1    /content/drive/My Drive/Dog vs Cat/train/cat.9...    cat
2    /content/drive/My Drive/Dog vs Cat/train/cat.9...    cat
3    /content/drive/My Drive/Dog vs Cat/train/cat.9...    cat
4    /content/drive/My Drive/Dog vs Cat/train/cat.9...    cat
- Check how many data present for dog and cat
df_catvsdog['picture_label'].value_counts().plot(kind='bar');
plt.xticks(rotation =True)
Result
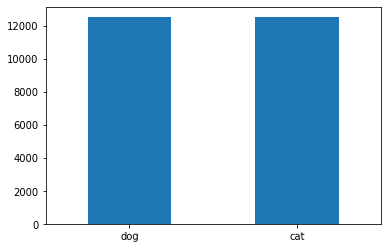
df_catvsdog['picture_label'].value_counts()
Result
dog    12500
cat    12500
Name: picture_label, dtype: int64
Shuffle the data so that there will be a sequence of data changed Note :- Random state is use because every time you shuffle the data always be same
from sklearn.utils import shuffle
df_shuffle = shuffle(df_catvsdog, random_state=101).reset_index(drop='True')
df_shuffle.head()
Result
file_name    picture_label
0    /content/drive/My Drive/Dog vs Cat/train/cat.3...    cat
1    /content/drive/My Drive/Dog vs Cat/train/cat.6...    cat
2    /content/drive/My Drive/Dog vs Cat/train/dog.7...    dog
3    /content/drive/My Drive/Dog vs Cat/train/cat.1...    cat
4    /content/drive/My Drive/Dog vs Cat/train/dog.7...    dog
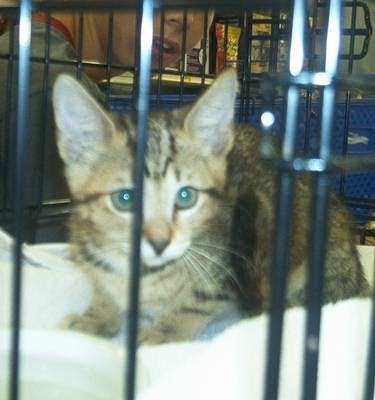
Check some images again
Image(df_shuffle.file_name[0])
Result
- As you know the computer always works on the number so we have to change our label into a number
X = df_shuffle['file_name']
labels = df_shuffle['picture_label']

unique_labels = np.unique(labels)

y = [label == unique_labels for label in labels]

unique_labels
Result
array(['cat', 'dog'], dtype=object)
Get data ready for Evaluation For that:-
- Change Images into IMAGE number
- Convert the IMAGE NUMBER Into Tensor Image Number
- Make all number which is present Tensor Image Number in between (0,1)
- Create the batches
- Visualize the data
Note:- Always try to create a function it can be more generalized to use
Here, we create some function which helps to change our images into tensor images
# Convert the image into tensor, channnelize ,resize and value in between [0,1].
def Image_to_Tensor(path, img_height= 224, img_width=224):
  """
  This function will convert the image into tensor, channnelize ,resize and value in between [0,1].
  """
  ## Read the picture
  image = tf.io.read_file(path)
  ## read the image in RBG format
  image = tf.image.decode_jpeg(image, channels=3)
  ##change the image so each value lie in between 0 to 1
  image = tf.image.convert_image_dtype(image, tf.float32 )
  ## Resize the image according to given imput
  image = tf.image.resize(image, [img_height, img_width])

  return image
## Data in the form of (image, label)

def data_layout(path, label):
  '''
  This function will retrun in data in form of (image, label)
  '''

  image = Image_to_Tensor(path)

  return image, label
In deep learning/computer vision, it is better to make your data into batches. It will help model to generalize their prediction and help to improve the model.
## Define the function which convert data into batches

def process_image(X, y=None, batch_size=32, test_data=None, val_data=None):

  '''
  This function will convert the process the image path and convert them into format that can be evaluatable
  '''

  # process image for test data
  if test_data:
    data = tf.data.Dataset.from_tensor_slices((tf.constant(X)))
    data_batch = data.map(Image_to_Tensor).batch(batch_size)

  # proces for validation data
  elif val_data:
    data = tf.data.Dataset.from_tensor_slices((tf.constant(X),
                                              tf.constatn(y)))
    data_batch = data.map(data_layout).batch(batch_size)

  # Validation image for training data
  else:
    data = tf.data.Dataset.from_tensor_slices((tf.constant(X),
                                              tf.constant(y)))
    data = data.shuffle(buffer_size=len(X))

    data_batch = data.map(data_layout).batch(batch_size)

  return data_batch
Create the train batches
full_data= process_image(X, y)
full_data
Result
<BatchDataset shapes: ((None, 224, 224, 3), (None, 2)), types: (tf.float32, tf.bool)>
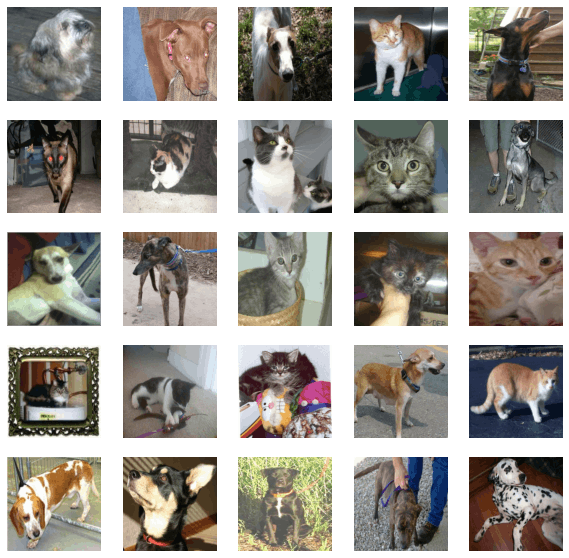
Visualizing the image after resize
def visual_image(images, labels):
  '''
  Visualizing the 25 images
  '''

  plt.figure(figsize =(10,10))
  for i in range(25):
    plt.subplot(5, 5, i+1)
    plt.imshow(images[i])
    #plt.title('Cat' if labels[i] == False else 'Dog')
    plt.xticks([])
    plt.yticks([])
    plt.axis('off')
Now try to visualize 25 Images
images, labels = next(full_data.as_numpy_iterator())
visual_image(images, labels)
Result
Setting for model
- Set the data format for INPUT, OUTPUT and model URL
- Use a sequential method of tf.keras for model
- compile the model with loss function, Optimizer, and metric
- Build the model
Note:- Here we use the transfer learning method. So we will those will actually be trained. Here we are using one of the models from tensor flow hub %[tfhub.dev/google/imagenet/mobilenet_v2_130_..
Again we try to create the function which will help to generalize our code
# Set the Image size
IMG_HEIGHT = 224
IMG_WIDTH  = 224

# Set the input
INPUT = [None, IMG_HEIGHT, IMG_WIDTH, 3]

# Set the Output
OUTPUT = len(unique_labels)

# URL For the model
MODEL_URL = 'https://tfhub.dev/google/imagenet/mobilenet_v2_130_224/classification/4'
The function which will create the model
 define the function to create the model
def create_model(INPUT_SHAPE , OUTPUT_SHAPE, Model_url):

  '''
  The fuction used for create the model
  '''
  print('Model training:', Model_url)
  # crete the model
  model = tf.keras.Sequential([
                               hub.KerasLayer(Model_url) ,
                               tf.keras.layers.Dense(units = OUTPUT_SHAPE,
                                                     activation = 'softmax')
                               ])

  # Compile the model
  model.compile(loss = tf.keras.losses.CategoricalCrossentropy(),
                optimizer = tf.keras.optimizers.Adam(),
                metrics = ['accuracy'])

  # Build the model
  model.build(INPUT_SHAPE)

  # Retrun the model
  return model
Creating callbacks Callbacks are helper function a model can use during training to do such things as save its progress, check its progress or stop training early if a model stop improving
We'll create two callbacks, one for TesnsorBoard which helps track our model's progress and another for early stopping which prevents our model fro training too long.
TensorBoard Callback To tensorborad notebook:-
- Load the TensorBoard notebook extension
- Create a TensorBoard callback which is able to save logs to a directory and pass it to model's fit() function
- Visualize our models training logs with the %tensorboard magic function(after training the model)
## Load TensorBoard notebook extension
%load_ext tensorboard
import datetime

def create_tensorboard_callback():
  # Create a log directory for storing TensorBoard Logs
  logdir = os.path.join('/content/drive/My Drive/Dog Vision/logs',
                        # Make it so the logs get tracked whenever we run an experiment'
                        datetime.datetime.now().strftime("%Y%m%d-%H%M%S"))
  return tf.keras.callbacks.TensorBoard(logdir)
Early stopping Early stopping helps stop our model from overfitting by stopping training if a certail evaluation metric stops improving
full_model = create_model(INPUT, OUTPUT, MODEL_URL)
Train the model
## Train the model
full_model.fit(x=full_data,
               epochs = 100,
               callbacks =[tensorboard, early_stopping])
The result - It will take approve 2hrs to process 25000 data
Epoch 1/100
782/782 [==============================] - 9054s 12s/step - loss: 0.0591 - accuracy: 0.9782
Epoch 2/100
782/782 [==============================] - 119s 152ms/step - loss: 0.0343 - accuracy: 0.9889
Epoch 3/100
782/782 [==============================] - 119s 152ms/step - loss: 0.0306 - accuracy: 0.9901
Epoch 4/100
782/782 [==============================] - 118s 150ms/step - loss: 0.0285 - accuracy: 0.9904
Epoch 5/100
782/782 [==============================] - 118s 151ms/step - loss: 0.0268 - accuracy: 0.9912
Epoch 6/100
782/782 [==============================] - 118s 151ms/step - loss: 0.0264 - accuracy: 0.9918
Epoch 7/100
782/782 [==============================] - 118s 151ms/step - loss: 0.0269 - accuracy: 0.9906
Epoch 8/100
782/782 [==============================] - 119s 153ms/step - loss: 0.0233 - accuracy: 0.9921
Epoch 9/100
782/782 [==============================] - 119s 152ms/step - loss: 0.0235 - accuracy: 0.9917
Epoch 10/100
782/782 [==============================] - 118s 151ms/step - loss: 0.0230 - accuracy: 0.9918
Epoch 11/100
782/782 [==============================] - 120s 153ms/step - loss: 0.0234 - accuracy: 0.9920
<tensorflow.python.keras.callbacks.History at 0x7f919868a898>
Save the model
#Save the model
def save_model(model, prefix = None):
  '''
  This function is use for saving the model
  '''

  model_dir = os.path.join('/content/drive/My Drive/Dog vs Cat/Models/',
                           datetime.datetime.now().strftime('%Y%m%d-%H%M%S')
                           )
  model_path = model_dir + '-' + prefix  + '.h5'

  print(f'Saving the model at {model_path}....')

  model.save(model_path)

  return model_path
Load the model
# Load the model
def load_model(path_name):

  '''
  This fuction is use for loading the model
  '''

  model = tf.keras.models.load_model(path_name,
                                     custom_objects = {'KerasLayer': hub.KerasLayer})

  return model
Save the model so that we can use it in the future
save_model(full_model, prefix='full_model_cat_vs_dog_mobilenetv2_adam')
Result
Saving the model at /content/drive/My Drive/Dog vs Cat/Models/20200815-103434-full_model_cat_vs_dog_mobilenetv2_adam.h5....
'/content/drive/My Drive/Dog vs Cat/Models/20200815-103434-full_model_cat_vs_dog_mobilenetv2_adam.h5
Lode the model
full_loaded_model = load_model('/content/drive/My Drive/Dog vs Cat/Models/20200815-103434-full_model_cat_vs_dog_mobilenetv2_adam.h5')
You can evaluate that both models are same
full_model.evaluate(val_data_batches)
Result
13/13 [==============================] - 2s 138ms/step - loss: 0.0064 - accuracy: 0.9975
[0.006375470198690891, 0.9975000023841858]
for loaded model
full_loaded_model.evaluate(val_data_batches)
Result
13/13 [==============================] - 2s 135ms/step - loss: 0.0064 - accuracy: 0.9975
[0.006375469733029604, 0.9975000023841858]
Now it's time to test your model on test data. Are you excited?
Load the path for test data
## Loading data of test data path

test_data_path = os.listdir('/content/drive/My Drive/Dog vs Cat/test1')
test_file_name = ['/content/drive/My Drive/Dog vs Cat/test1/' + name for name in test_data_path]
len(test_file_name)
Result
12500
create the file path for test data
# Test on first 25 images
test_draft_data = np.array(test_file_name[:25])
test_draft_data[:5]
Result
array(['/content/drive/My Drive/Dog vs Cat/test1/12041.jpg',
       '/content/drive/My Drive/Dog vs Cat/test1/12027.jpg',
       '/content/drive/My Drive/Dog vs Cat/test1/12045.jpg',
       '/content/drive/My Drive/Dog vs Cat/test1/12026.jpg',
       '/content/drive/My Drive/Dog vs Cat/test1/12020.jpg'], dtype='<U50')
Process the image on test data and predict the data
test_draft_data_batch = process_image(test_draft_data, test_data=True)
test_draft_data_predict = full_loaded_model.predict(test_draft_data_batch)
Create which will help to visualize you result
def plot_predicted_figure(images, predict_label):
  '''
  This function will show the images of predicted label

  For Valid data set if predicted label and true label not match the title will be 'RED' else 'GREEN'
  '''
  plt.imshow(images)
  plt.xticks([])
  plt.yticks([])
  ## Check wheather the label is correct or not
  colors = 'orange'
  if true_label:
    if true_label == predict_label:
      colors = 'green'
    else:
      colors = 'red'
  plt.title(predict_label, color=colors)
Visualize 25 images of data, Note:- Here we doing unbatchify process because we are creating an image from batch data and batch data in the form of (Images, labels) so we have to unlatch the see the result
## Define the function to which is use to visualize the predicted model

def Show_predicted_25_image(prediction, data_batches, test_data = False):

  '''
  This fuction is use to show the first 25 predicted images

  '''
  ## Number fo images to be printed
  nrows = 5
  ncols = 5
  num_images = nrows * ncols

  ## Define which help to return the predicted label value
  def know_predicted_label(label_weight):

    label = unique_labels[np.argmax(label_weight)]
    return label

  ## Getting labels which are predicted by model
  predicted_label = []
  for i in range(num_images):
    predicted_label.append(know_predicted_label(prediction[i]))

  ## Unbatchify the image, label from batch data
  images = []

  for image in data_batches.unbatch().as_numpy_iterator():
     images.append(image)

  ## Visualizing the images and their label values for
  num_images = nrows * ncols
  plt.figure(figsize=(8,10))
  for i in range(num_images):
    plt.subplot(5, 5, i+1)
    plot_predicted_figure(images[i],
                          predicted_label[i])
  plt.show()
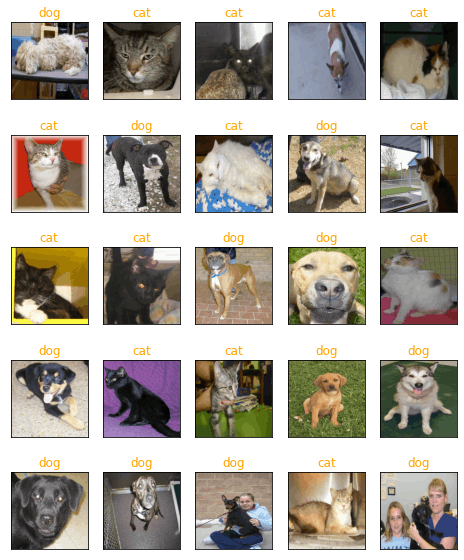
So you are ready to see you result !!!!!!! Here you are
Show_predicted_25_image(test_draft_data_predict, test_draft_data_batch, test_data=True)
Result
Now save your result in txt format
## Save predictions(numpy array) to csv file
np.savetxt('/content/drive/My Drive/Dog vs Cat/preds_array_cat_vs_dog_test_data.csv', full_test_data_predictions, delimiter =",")
Predict on your's provided pictures
For that save some pictures in your google drive. Then do the same process of test data prediction.
## Loading data of test data path

user_data_path = os.listdir('/content/drive/My Drive/Dog vs Cat/User')
user_file_name = ['/content/drive/My Drive/Dog vs Cat/User/' + name for name in user_data_path]
Process the image
# Creating batches for full data set
user_data_batch = process_image(user_file_name, test_data=True)
Prediction on pictures
# Prediction on user
user_prediction = full_loaded_model.predict(user_data_batch)
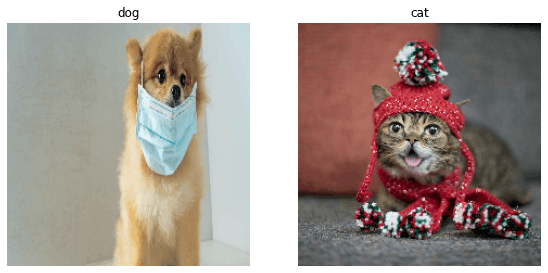
Create a function to visualize your data
def cat_vs_dog_predicition_user(predicted_value, data_batch):

  # Get the breed name from the predicted Value
  predicted_label = []
  for i in range(len(predicted_value)):
    predicted_label.append(unique_labels[np.argmax(predicted_value[i])])

  # Unbatchify the image
  images_usr = []
  for images in data_batch.unbatch().as_numpy_iterator():
    images_usr.append(images)


  # Show the image and their label
  plt.figure(figsize=(20,20))
  for i in range(len(predicted_label)):
    plt.subplot(1,4, i+1)
    plt.imshow(images_usr[i])
    plt.xticks([])
    plt.yticks([])
    plt.title(predicted_label[i])
    # Turn the greed line off
    plt.axis('off')
cat_vs_dog_predicition_user(user_prediction, user_data_batch)
Result Look at them they are so cute .........